Fundamental vs. technical analysis: what are the differences?
Learn what fundamental and technical analysis are in the commodities market. Understand the role of each in risk management.
Fundamentalist analysis and technical analysis are important for those who work in the commodities market. Both have the same objective: to predict price trends to guide decision-making.
However, how each carries out this process is not the same. In this content, you will understand the main differences between the two methodologies and their application in risk management for agricultural and energy commodities.
Read on to find out more!
Commodities: what is fundamental analysis and how does it work?
In order to trade any asset on the financial market, it’s important to know about particular aspects of the industry and its consumers. When we talk about agricultural commodities, for example, it is essential to understand the main factors that influence the balance between supply and demand at a global level.
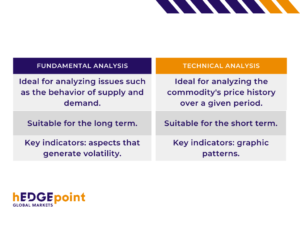
This knowledge allows us to build a good perspective on the price movement of a commodity in the medium and long term. In this sense, fundamental analysis seeks to understand the relationship between supply and demand in various markets.
They are therefore characterized as a means of examining market behavior. The main purpose of this method is to predict the future path of least resistance for the prices of a certain commodity.
Commodity price movements are long. In other words, they move with a lower level of volatility than most financial assets. This is because they have more solid and well-defined supply and demand structures.
Given this situation, fundamental analysis looks precisely at the aspects that generate volatility, which includes
- Geopolitical and macroeconomic changes.
- Climatic phenomena.
- International circumstances that could affect global supply and demand.
- Regional seasonality.
- Financial policies.
- Consumption indicators.
- Productivity indices.
Bear in mind that fundamental analysis is not intended to understand short-term price fluctuations. In practice, they look at the added value of commodities over time. They are therefore suitable for players who want to position themselves for long-term returns.
And what is technical analysis in commodities?
With technical analysis, we can identify trends in asset prices. In this way, we understand which force is stronger, namely the buyer or the seller. This makes it easier to see whether prices are rising or falling, and how strongly.
In technical analysis, statistics are used to recognize specific patterns and past price movements to determine future price movements. Unlike fundamental analysis, the focus of technical analysis is on the short term, which can range from one day to a maximum of one year. Below, we explain some of the main information covered by this method.
1. Price patterns
When looking at a chart, the patterns identified signal that the price of a commodity will move in a certain direction. The double top and double bottom pattern are one of the most commonly applied, as it indicates a possible reversal in the direction of the current price trend.
With this pattern, if the price rises to the same level twice, but never exceeds in a certain period, it signals a possible fall in price over the next few days. Now, when the chart forms a drawing that resembles a head and shoulders, that’s another pattern and signals a future reversal.
In addition, there is a graph that forms triangles when displaying the price movement of an asset. This is an indication that the value of the product will soon break the pattern in the direction of the current trend.
Example chart with the top/bottom pattern under analysis
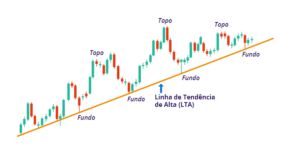
Source: hEDGEpoint HUB
- Read here: Understanding how commodity prices are set
2. Market trends
It occurs when the price of a commodity moves in a predictable direction because of the relationship between the volumes of investments in the asset in question.
In the case of uptrends, for example, there are specific phases. Among them is the accumulative phase. This is characterized by a chart with rising tops and bottoms and signals that buyers have begun to accumulate assets.
This is a time of opportunity, as prices are falling, and the market is not yet expecting to rise. There is therefore greater demand for the assets. The next moment, as there is pressure from demand, the price starts to rise.
After the accumulation, in which prices began to rise due to strong pressure from demand, investors accumulated assets. They then began to distribute them, setting up a downtrend. This is the moment when selling becomes stronger. As a result, the quantity on offer exceeds demand. Tops and bottoms then get lower and lower.
Finally, there is the lateralization trend, which is when the price of the paper oscillates within a well-defined band without rising or falling much. After the strong pressure on supply and the fall in prices, there is a more neutral phase, which is characterized by stabilization.
Graph with the three simultaneous trends.
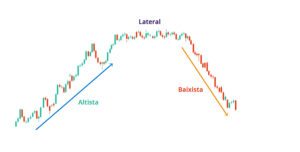
Source: hEDGEpoint HUB
What is the role of fundamental and technical analysis in commodity risk management?
Fundamentalist analyses are important for risk management in the commodities market, as they analyze the supply and demand behavior of various assets. As a result, they provide extensive knowledge about these factors that influence future prices.
This knowledge is shared through market intelligence reports, which are produced regularly. They are essential for supporting decision-making by producers and buyers throughout the production and marketing cycle.
Fundamental analysis thus gives you the ability to choose highly targeted risk management tools. After all, they provide solid information on the expected price trend, which considerably increases the effectiveness of operations.
Technical analysis, on the other hand, determines future commodity prices by analyzing the history and graphical behavior of prices in the past. To do this, they are based on patterns that are repeated in the market.
In this way, they contribute to risk management as they help players detect investor behavior. In other words, they understand whether they are more likely to buy or sell. With this, participants can adjust their positions by observing price trends, and buying and selling assets quickly.
Read also:
- Hedging commodities: why is it an excellent option in this market?
hEDGEpoint HUB: market intelligence on commodities
hEDGEpoint HUB gives you easy access to fundamental and technical analysis. Through our platform, we offer market intelligence reports and exclusive courses for players in the commodities sector.
Our in-depth content brings you the position of hEDGEpoint professionals on climate issues, geopolitical decisions, crop projections and other relevant information in this market. In this way, you can deepen your knowledge of global movements and hedging instruments to manage risks based on these scenarios.
Rely on hEDGEpoint’s market intelligence and gain a basis for your business decisions!

